Other Geoprocessing Platforms
In this Case Study/Lesson the user will explore multiple software platforms to accomplish common tasks as would have been learned in an Introduction to Digital Maps Course (KCTCS number CIT 125). The platforms which will be explored are Esri ArcGIS Pro, Esri ArcGIS Online and QGIS (an open source software). The geoprocessing conceptualization is independent of the platform, but the tools will be located in different places. The learner will accomplish a list of tasks for each platform. Some tasks are not supported in all platforms.
The ArcGIS Pro application (version 2.2 or higher) must be installed on a desktop/laptop computer. The user will need to have an Esri account to login into the software after it is installed (if you are enrolled student your instructor should provide this to you). The user account should have accessibility to the organizational folders, if unsure contact your instructor. The application may prompt for updates. This application is a 64 bit program and must be installed on a 64 bit Windows operating system.
Process
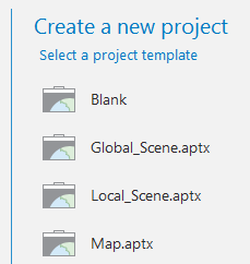
Open the ArcGis application; on the right side of the monitor under ‘Create a new project’ choose ‘Blank’. Provide a name for the project.
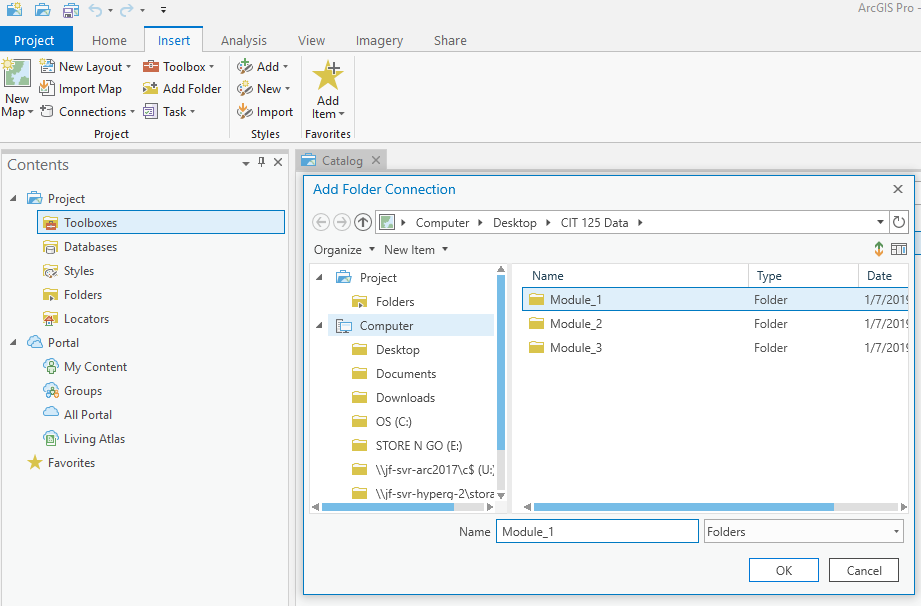
Under the Insert tab choose Add Folder. Navigate to the folder containing the desired data and connect to it at the folder level. The folder containing the data will now be available under the Catalog. Then right click on a file and select add it to map.
Topics
Clip
Clip is the process of extracting a portion of a line (could be polygon or points) bounded by a polygon layer. The user will need a polygon layer and a line layer, the line feature should extend beyond the polygon boundary. Select the Analysis tab, Clip will be a function in the tools window, select Clip, the tool will open on the right side (general location), and will need the user to provide the requested information.
Merge
Merge is the combining of two or more files. For this example the user will need two or more polygon layers of the same type, i.e. census tracts. The files do need to touch, but for this example it is recommended. Select the Analysis tab, Merge will be a function in the tools window, select Merge and it will open on the right side (general location), provide the requested information in the Merge window.
Spatial Join
Spatial Join will count the number of items within a polygon file (there are additional functions). The user will need one point file, which has information bounded by a polygon file. Select the Analysis tab, Spatial Join will be a function in the tools window, on the right side of the program a spatial join window will open (general location), provide the requested information.
Buffer
Buffer in general is used to create a polygon file about another feature file (there are cases where the Buffer can be internal and not external but only for a polygon). The user will need a feature class file and the file must have a projection. Select the Analysis tab, select Buffer which is a function in the tools window. Once selected on the right side (general location), a window will open requesting information. The multiple ring buffer is not available yet in this platform.
Tabular Join
Tabular Join is the process of combining tabular data (like a spreadsheet) with a feature file. Each file must have a common field with a common format and information. This function for example will give the user the ability to display the information of a spreadsheet geographically. The common field must be of the same data type, such as text or numbers. The function is located under the Data tab, select Joins. The two input files and the common fields must be denoted. After the join is completed the shapefile will need to be exported to make it permanent.
Query
A query is used to ask questions of the data, for example if a feature file contains the average incomes of each county in a state, a query might be used to show those incomes over a specific threshold. This is known as a Definition Query. A feature file is required that has data that varies by geography. The information created in the Tabular Join would be appropriate data set. Open the properties window of a layer, by double clicking on the layer. Select the Definition Query and select add clause. Using the appropriate pull downs create several queries to explore how they function.
Label
Labeling is generally used to provide information for a user. A shapefile is required that contains information about the feature. Highlight the feature and select the Labeling tab (will only appear for features). The zoom levels of the labels can be selected from this tab. Classes of labels can also be made. Make sure that Label is selected.
Zoom
The Zoom tool is generally used to show or hide certain layers at specified geographic level. For this example at least two feature files are required. Select the Appearance tab and select the range on the far left slide. There are two different ranges to select, in Beyond and out Beyond. Experiment with different values in the two range locations to see how they work.
Symbology
Symbology is used to change the appearance of data, such as color, symbol, line thickness and fill characteristics. Setting colors based on information contained within the feature file can also be done. At least one feature file is required, but it is suggested that at least two are used. Select the Appearance tab, select Symbology, a pull down window should will open with different types of symbology, select the single symbol type. Once the selection is made, a window will open on the right side. Change the color of the symbol and the size. Next using Graduated Colors change the appearance based on information within in the field.
Publishing
The publishing process is very different from what was done in ArcGIS Desktop. The process of publishing will create a ‘printable’ map that contains items such as scale bar, title, legend, etc. At least two feature files should be used in the publishing process. Under the Insert tab select New Layout and select an appropriate 'paper' type. A new ribbon is shown. A new tab will be located next to the map and catalog tabs called layout. On the layout map, select Map Frame from under the Insert tab. A map should be generated, note the drawing order to the left. Add typical map publishing items.
ArcGIS Online
ArcGIS Online in general does not contain all the commands found in desktop software and is referred to as AGO. Publishing a final map is not available since this is more of a online map platform. The clip and query geoprocessing tools are not directly available. Also, data is handled differently in AGO all files must be uploaded in a compressed format. Some data to work with can be downloaded here.
Topics
Merge
Merge is the combining of two feature files. For this task the user will need two polygon layers of the same type, i.e. census tracts. Note in the Merge process in AGO only two files can be combined at one time. The files do need to touch, but for this example it is recommended. Select the Analysis tab, then Manage Data, and then Merge Layers. A window will open requesting the file names and the output file.
Spatial Join
Spatial Join will count the number of items within a polygon file (there are additional functions). The user will need one point file, which has information bounded by a polygon file. Select the Analysis tab, Summarize Data and then Join Features, note this function will be used both for spatial and tabular joins. In the Join Features the target will be the bounding layer and layer to join will be the points (parts 1 & 2). On part 3 select spatial relationship and choose completely within. On part 4 select Join one to many. Then in part 5 provide a unique name.
Buffer
Buffer in general is used to create a polygon file about another feature file (there are cases where the Buffer can be internal and not external but only for a polygon). The user will need a feature class file. Select Analysis tab, then select Use Proximity and then Create Buffer. In the Buffer Process it is similar to ArcGIS Desktop and multiple ring buffers can be created.
Tabular Join
Tabular Join is the process of combining tabular data (like a spreadsheet) with a feature file. Each file must have a common field with a common format and information. This function for example will give the user the ability display the information of a spreadsheet geographically. The common field must be of the same data type, such as text or numbers. Select the Analysis tab, Summarize Data and then Join Features, note this function will be used both for spatial and tabular joins. In part 1 select the feature file to information joined to, in part 2 select the tabular data, in part 3 select Chose the Fields to match, and then select the common field for the feature file and the table. In part 4 select Join one to one, finally in part 5 select the output file name.
Label
Labeling is generally used to provide information for a user. A shapefile is required that contains information about the feature. Click on the three dots (more options) of any layer. A window will open and select Create Labels. Make sure the Label Features check box has been selected and select an appropriate field. The zoom levels of the labels can be selected by using the two pointers in the visible range, what is between the pointers is what will be visible.
Zoom
The Zoom tool is generally used to show or hide certain layers at specified geographic level. For this example at least two feature files are required. A shapefile is required that contains information about the feature. Click on the three dots (more options) of any layer. Select Set Visible Range, a window will open that uses two pointers in the visible range, what is between the pointers is what will be visible. Experiment with different values to see how they work.
Symbology
Symbology is used to change the appearance of data, such as color, symbol, line thickness and fill characteristics. Setting colors based on information contained within the feature file can also be done. At least one feature file is required, but it is suggested that at least two are used. The symbology is located in the style area for each layer, select the style icon. When style window opens select Symbol, which allows for the modification of the appearance of the features.
QGIS
This lesson will use QGIS (Quantum GIS) Version 3.4.x 64 bit. This is an open source software platform that is free to download and install, which must be accomplished prior to beginning this lesson. While this software is not associated with Esri it will read shapefile (shp) formats as well as geodatabases (gdb). There are companies that are external to QGIS that offer customer support, but QGIS does not directly offer support, but does have a strong user community. Publishing will not be required for this lesson.
Topics
Clip
Clip is the process of extracting a portion of a line or other features, that extends beyond a polygon layer. The learner will need a polygon layer and a line layer, the line layer should extend beyond the polygon layer. Select Vector tab, then Geoprocessing Tools and select Clip. A new window should open to input the requirements.
Merge
The merge tool combines two or more polygon files (other feature types can also be combined). The learner needs two or more polygon layers of the same type, i.e. two or more census tracts. The files do need to touch, but it is recommended for this example. Select Vector tab, then Data Management Tools and select Merge Vector Layers. A new window should open to input the requirements. Make sure to input all the layers to be merged together.
Spatial Join
Spatial Join counts the number of items within a polygon file (there are additional functions). The learner will need one point file which is contained within a polygon file. Select Vector tab, then Analysis Tools and select Count Points in Polygon. A new window should open to input the requirements.
Buffer
Buffer is generally used to create a polygon file about another file (there are cases where the Buffer can be internal and not external but only for a polygon). The learner will need a shapefile, and there must be an assigned projection. Select Vector tab, then Geoprocessing Tools and select Buffer. A new window should open to input the requirements. Note the default distance will be the default coordinate system, this command does not allow for multiple distances. The output file default is to create a temporary file.
Tabular Join
Tabular Join is the combining of tabular data (like a spreadsheet) with a feature file. The two files must have a common field and format. This function for example will give the user the ability display the information of a spreadsheet geographically. The common fields must be of the same data type, such as text or numbers. The function is located in the properties window (accessed by right clicking on the layer to receive the information). Next click on the plus sign to open the Add Vector Join window, Select the table and the field and then select the field on the vector (shapefile) layer. Selected OK twice to complete the process. Look at the attribute table to make sure the join was done successfully.
Query
A query is used to ask questions of the data, for example if a feature file contains the average incomes of each county in a state, a query might be used to show those incomes over a specific threshold. A feature file is required for this example, that has data that varies by geography. The information created in the Tabular Join would be appropriate. This function is part of the layer properties window, by double clicking on the layer the property window will open. Select the Source tab and on the far lower right corner select Query Builder. Using the appropriate pull downs and buttons to create several queries to explore how the function works.
Label
Labeling is generally used to provide information for a user. A shapefile is required that contains information about the feature. Select the feature and open the Layer Properties window, the Labeling tab is on the left side of window. The window will appear empty, use the pulldown and first select single labels. Label the features of the shapefile all the same at all zoom levels select a field to use for the label. Other parameters such as color and size can also be selected. To do zoom levels for labeling, select Rule-based labeling instead of single labels and then using the plus button, set the dynamic zoom levels by check the scale range and then input the minimum and the maximum ranges and field to use for labeling. Make sure that no other edit rules are selected.
Zoom
Dynamic zoom generally is used to show or hide certain layers at specified zoom level. At least two feature files are required, so that one can be controlled and the other one will remain visible. Right click on a layer and select Set Layer Scale Visibility for the selected layer. There are two different ranges to select, a minimum and a maximum. To make this selection check the Scale visibility box.
Symbology
Symbology in general is used to change the appearance of data. At least one feature file is required, but it is suggested that at least two files are used. Symbology is located in the layer property window. First change all the data without an rules, next use a specific field and change the appearance based on the information within in the field, this is known as a categorize or classification; once the parameters are set the user must press the classify button.
