Georeferencing
|
Georeferencing (Rubbersheeting) Storyline
|

|
The process for displaying a paper map in a GIS, first requires that the map has been scanned or photographed, this creates a digital image of the analog map. The digital image will be a raster and generally is in a dot matrix format, which means it will have a maximum usable resolution. The higher the quality of the scan, the more in-depth the map image can be viewed. If the map is larger than the available scanner it can be scanned in pieces, make sure that there is sufficient overlap between the images created. Then a program like Adobe Photoshop or GIMP is required to stitch[1] the map back together. Many applications may not need the entire map for the study. It should be noted that there are many scanned maps already available online and therefore scanning will not be required. Combining the map images when possible before using the geospatial software is advised, but they could be combined in the software as separate images. There are times when cutting the map apart due to drawing errors can make for a better digitized image. While an electronic image of the paper map is available, it has no geographical reference and therefore cannot be overlaid on a geographical coordinate system. This lesson will discuss how to accomplish the geospatial referencing of maps.
Georeferencing is the process of aligning an image to the earth’s grid. In theory it should be as simple as clicking on four points on the scanned map and four corresponding points on the reference map and it should align, but the reality is that the scanned map is normally not projected and depending on the age might have inherent issues. This lesson will discuss the methods required to create a geospatially referenced map from historical maps that are not georeferenced. There are some online sites that have historical maps that are georeferenced, such as the Harvard University Map Collection. Most likely unless you are dealing with a historically significant area the map will not have been georeferenced.
There are several areas of particular interest to different groups of map makers:
- Civil War Battlefield maps drawn at the time of the conflict were created during or soon after the battles as part of official reports. Topological engineers were used to better understand the terrain of different locations, so that these features could be used to the advantage of the opposing armies. Both the Union and Confederate forces had very good topographers/cartographers. Yet there are numerous examples of when a feature on the battlefield is a complete misrepresentation.

Figure 1: Land Division, from the Illinois Secretary of State (http://www.cyberdriveillinois.com/departments/archives/databases/data_lan.html)
|
|
- One type of urban map which contains lots of information about cities and towns are Sanborn Fire Insurance maps, they were first created during the second half of the 1800s and continued through the first half of the 1900s. As thier name indicates these very detailed maps were drawn so that local insurance agents would know how to calculate insurance rates for local homes and businesses. These maps have detailed information that can be used to understand how cities grew. Some of the interesting material contained on these maps are business construction type, heating sources, lighting sources, night watchman, location of telephone fire alarm boxes and location of fire protection cisterns.
One of the best sources for historical maps is the Library of Congress map collection which is an online service located at: http://lcweb2.loc.gov/ammem/gmdhtml/gmdhome.html. Many maps of historical significant areas are located at this site as well as older maps and modern maps. Once the map is located online and downloaded it must be placed in a format that can be used by the geospatial software. If the map is in a standard JPEG, TIFF image formats it can be loaded directly into Esri ArcMap Desktop, as well as the MrSid format. There are other image formats such as JPEG 2000 (JP2), which are used at the Library of Congress that cannot be directly opened by the mapping software and require a middle step. For JP2 the image must be opened in photography software such as Adobe Photoshop Elements.[3] Once the image is opened in the photographic editing software, save it as a TIFF file format, it is also recommended changing the name of the file to something which is descriptive, since many of the image names are not descriptive because the sites have a large number of them. Once the operation has been completed exit the photographic editing software and open the image in Esri ArcMap Desktop. Note: the image file should be closed in the photographic editing software before trying to load it into the mapping software.
To successfully georeference a map image file a referenced file is required as the base layer. The base layer will be used to compare the information with the map image file. The base layer must be projected, and should have a geographic coordinate system. It is important to realize if you are doing a visual comparison between the historical map image and a current orthographic image[4] or vector shapefile that geographical features do change; this would include the location and width of roads, names of roads, location of railroads, and changes in a stream path both due to nature and man.
Be aware that the historical map creator may not have had accurate information so the placement of features may vary. In some cases, battlefield maps were created as the battle was occurring. Yet it is extremely valuable to utilize historical maps to create modern maps. The author has used maps from the early 1800s and sometimes the information is very well placed on the map, yet other maps have the correct general characteristics but not the accuracy that can be obtained today by aerial imagery. Realize that maps such as those from the Civil War, may be little more than sketches of the location and better maps were drawn after the conflict by cartographers who were not at the physical location of the battle. Orthographic aerial images are very good especially for structures that have not changed. For example, if the county courthouse was already built at the time of the map it can be a good location to use as a reference point. Other good points of reference are cemeteries, major road intersections and old neighborhoods (such as areas in which the houses were present at the time of the map and still exist), major structures usually noted on maps are churches and schools
Getting Started, the Process
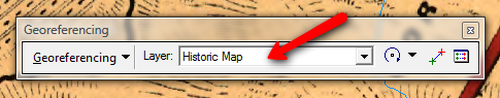 Figure 2: Georeferencing Toolbar, select image
Once the projected base layer is loaded, the map image file should be added; other files can be added to be used in the referencing process, but only two files (reference and map image) are required. In this technical skills lesson the image layer will be the map to be georeferenced and a reference layer or basemap will be used as the layer that positions are accurately identified. Make sure the image file is the first opaque layer. Initially the image will not be projected on the map surface. Use the Zoom to Layer command to see the map image. Open the georeferencing toolbar, which is under the customization tab. The toolbar can be docked or left as a free floating object. Once the georeferencing toolbar is opened make sure that the image filename is showing in the window, see Figure 2, and if it is not visible use the pull down arrow to locate it.
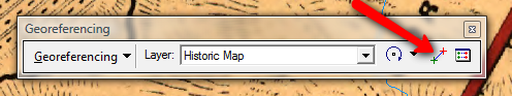 Figure 3: Georeferencing Toolbar
The next step is to find a location on the image and the same corresponding location on the reference layer (base map). Click the button with the red and green plus sign on the georeferencing toolbar, see figure 3. The cursor will become a plus sign, use the zoom tool to get an accurate position on the map image and select the position. Next select the same position on the reference layer by clicking on the appropriate location. This may require zooming to the reference layer and zoom in so that sufficient detail is available to find the corresponding point. When the point is located click on it, (note if the zoom tool was used, the red and green plus button may need to be selected again). With only one point referenced the map will not be displaying properly. The process needs to be repeated for a second point so that the map will have a two point reference. The second point should be as far away from the first point as possible to get the best results. Return to the image map (zooming to the image may be required, the back arrow can also be used), zoom to the appropriate detail level and click a location. Zoom to the reference layer and click on the corresponding point for the second point (The image layer may need to be turned off, if it is covering the reference layer.).
The image map should now be roughly covering the reference map. It is suggested that the user open the layer properties window for the image layer and make it semi-transparent. While the file has two points that are georeferenced additional points are required. For proper georeferencing a minimum of four points are needed. Repeat the same steps as discussed previously, the user should not have to zoom between the layers, since the layers are roughly georeferenced and the user has made the top opaque layer semi-transparent. At times due to the details on the image layer, it might be required to turn that layer off to see the location on the reference layer. If two points are too close together a warning message will be displayed and it can be accepted or not. As the process is continuing a single point might really corrupt the referenced map, these points can be deleted. This process is also known rubber sheeting[5].
The image map should now be roughly covering the reference map. It is suggested that the user open the layer properties window for the image layer and make it semi-transparent. While the file has two points that are georeferenced additional points are required. For proper georeferencing a minimum of four points are needed. Repeat the same steps as discussed previously, the user should not have to zoom between the layers, since the layers are roughly georeferenced and the user has made the top opaque layer semi-transparent. At times due to the details on the image layer, it might be required to turn that layer off to see the location on the reference layer. If two points are too close together a warning message will be displayed and it can be accepted or not. As the process is continuing a single point might really corrupt the referenced map, these points can be deleted. This process is also known rubber sheeting[5].
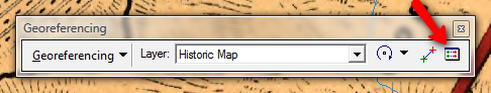 Figure 4: Georeferencing Toolbar Link Table
Click on the button that looks like a menu (see Figure 4); it will open up a list of all the georeferenced points (reference table).
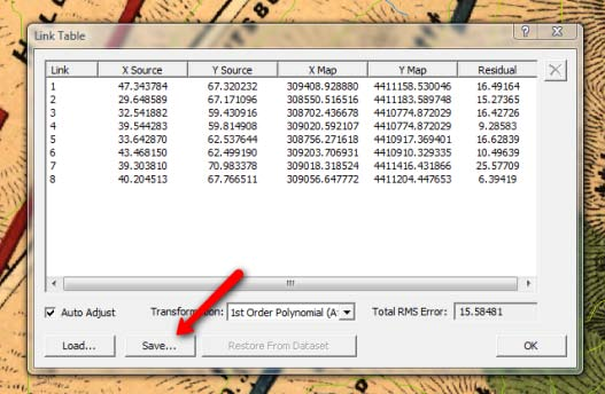 Figure 5: Link Table
If point 8 was the point that was poorly referenced then click on that line, see Figure 5. The line should be highlighted and press the delete key on the keyboard. Insure that this is the reference line to be deleted, because there is no confirmation statement before the deletion occurs. Once this process has been completed make sure the referenced data is saved. If the layer is removed and reloaded it will not be referenced unless a layer file was created. The reference table can be opened if it was saved, which will re-reference the image. Only one image file can be georeferenced on a map at a time, thus if another image file is loaded and selected for georeferencing the original referencing will be lost if it has not been saved. It is not practical to load the referencing information each time the file is used; therefore, a new layer should be created for each image file. This is done by right clicking on the file name and selecting Save As Layer File, if this operation is done after the georeferencing has been completed a geographically projected layer will be created, and can be displayed. The original image file can be removed from the map, but not deleted or moved since the layer file still utilizes this information. If the image file is moved the layer file will become broken since it does not contain the original image.
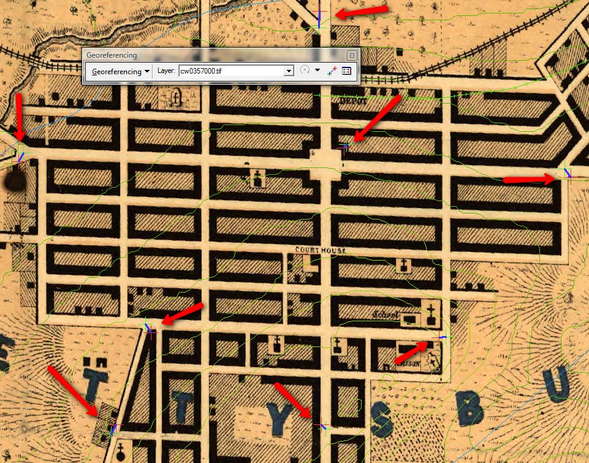 Figure 6: Final Result, Gettysburg, PA 1863 Map
The map shown in Figure 6, is a portion of a historical map of downtown Gettysburg created during the Civil War era. The red arrows point to the georeferenced points from the table in Figure 5. In a perfect georeferencing, with no stretching, each pair of points would be directly on top of one another. The greater the separation between points the greater the error in the process. Note: there is a line connecting the points, which is the amount of separation between the accurate location and the referenced location or the possible error. After successfully georeferencing the map, then digitization[6] of the information on the map can occur. After completing digitization, the historical map image file can be removed.
[1] Stitching is the digital process of accurately combing an images together, this can be done with photographs as well as scanned images.
[2] An acre is an area measurement, there are 640 square acres in a square mile.
[3] There are free software packages that can also be used for conversion such as GIMP.
[4] An orthographic image is the representation of three dimensional space in two dimensions. (http://vincedinoto.wixsite.com/geospatial/glossary)
[5] It is known as rubber sheeting since it is like stretching a piece of rubber, one part might be stretched more than another.
[6] Digitization in this instance refers to the manual copying of information from the image into vector shapefiles. When the original paper map was scanned was another form of digitization, from a photography reference.
