Digitizing
|
Digitizing Storyline
|

|
Introduction
This technical skills lesson explains how to manually add map information from non-vector data. This information could be from an image file that has been georeferenced to the surface of the earth or could be data collected manually from another device such as a GPS (Global Position System) receiver and the position manually plotted. In this technical skills lesson the data source will be an image file that was previously georeferenced. This lesson will only deal with the concept of creating new shapefiles and how to collect information from a map.
This technical skills lesson explains how to manually add map information from non-vector data. This information could be from an image file that has been georeferenced to the surface of the earth or could be data collected manually from another device such as a GPS (Global Position System) receiver and the position manually plotted. In this technical skills lesson the data source will be an image file that was previously georeferenced. This lesson will only deal with the concept of creating new shapefiles and how to collect information from a map.
Prerequisite
It is assumed that the learner has functional knowledge of ESRI ArcMap Desktop and how to create new layers and shapefiles. The learner should be an experienced mapper as obtained from an introduction to digital mapping class. It is further assumed that the learner has loaded image files onto a map and projected them. The image file must be properly aligned, prior to beginning this lesson, through a process known as georeferencing. The technical skills lesson on georeferencing is available to the learner, no digitization should be attempted prior to completing this process. The map should not be re-georeferenced once the digitalization process has begun. If the image file is re-georeferenced after the digitization is begun not all collected information will be accurately represented.
Getting Started
In this technical skills lesson features that are located on an image (raster) will be converted into a vector object (shapefile). The features can be points, lines or polygons. This will be accomplished by the manual digitalization of the image, using a mouse. A digitizing pad can be used but is not required to complete this lesson. If a touch screen is used insure that the screen has a high enough resolution to achieve the task.
To begin this lesson one or more basemap layers should be loaded into ArcMap and must have a geographical projection. These base layers can be shapefiles or an online service. One or more image files should to be loaded in ArcMap. These might be an aerial image or a paper map that has been scanned. The image file(s) need to be georeferenced to the basemap layer or a projected shapefile, i.e. that the features on the image file and the reference layer must align. It is suggested that the image file be a map layer. Note: some historical maps may lack the quality of surveying and cartography to align, thus an exact alignment between a historical paper map and the base referenced layer might not be possible. In addition realize that some features could have changed positions over time, such as a stream may have a slightly different path, or a crossroads may have been moved or roads moved to better align intersections.
The next step requires creating an empty Feature Class in ArcCatalog. If additional information beyond what is covered in this lesson about ArcCatalog is required, please refer to the Data Management Technical Skills lesson from the Introduction to Digital Maps[1]. In addition, make sure the shapefile is saved in a geodatabase and has the appropriate metadata.
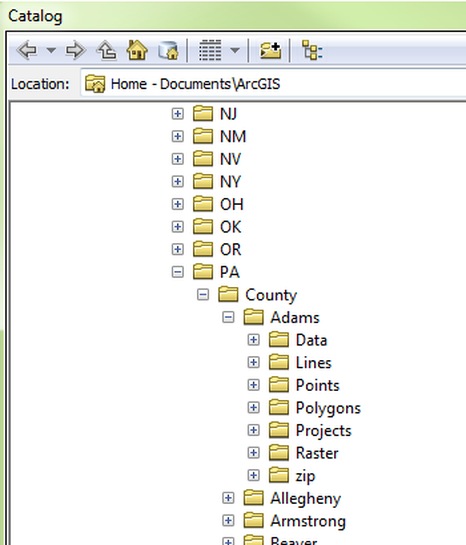 Figure 1: ArcCatalog
ArcCatalog
Open ArcCatalog either directly as a program or from within ArcMap. In Figure 1, the file structure for Pennsylvania (PA), Adams County (the county in which Gettysburg is the county seat) is shown. This level of file structure will make for better data management.
Open ArcCatalog either directly as a program or from within ArcMap. In Figure 1, the file structure for Pennsylvania (PA), Adams County (the county in which Gettysburg is the county seat) is shown. This level of file structure will make for better data management.
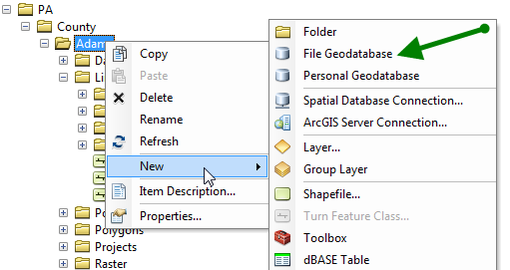 Figure 2 Creating a new File Geodatabase
Either left click on File on the menu bar and select New or right click on a file folder and select New, see Figure 2 (the second method is displayed). Next select the operation to be completed, for this example, a new File Geodatabase will be created. A shapefile instead of the geodatabase could be create and the results would be the same, but not recommended.
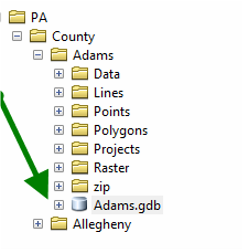 Figure 3: Adding Geodatabase
For this exercise a new geodatabase will be created and a new shapefile will be added to the geodatabase, see Figure 3. The geodatabase was created and renamed Adams, therefore it will only contain information about Adams County in Pennsylvania. In this geodatabase all vector files related to the Gettysburg mapping project will be stored, the geodatabase was placed in the Adams County folder.
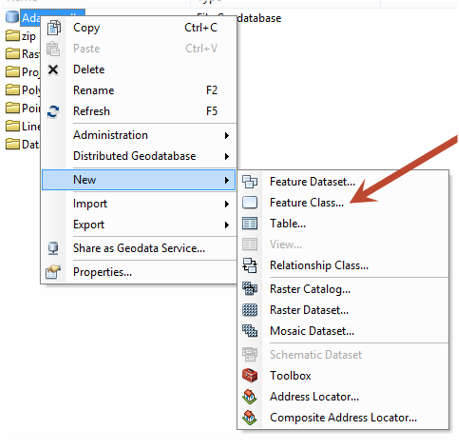 Figure 4: Creating a new Shapefile
To create an empty feature class the same procedure that was used for creating a new geodatabase will be used, except this time a file will be created. Right click the geodatabase and select new, see Figure 4. Then select Feature Class.
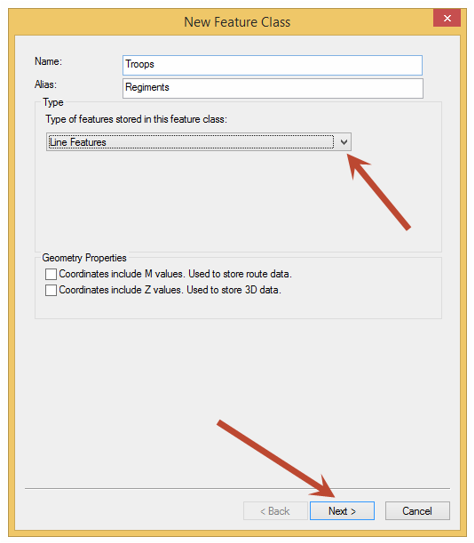 Figure 5: Creating a Polyline Shapefile
The first item to be digitized will be the troop positions. They will be represented with line features. Right click on the geodatabase icon, select New then select Feature Dataset. A descriptive name for the file is required, avoid special characters (including spaces). An alias can be used with spaces. Use the pull down arrow and select Line Feature for the type of file. See Figure 5 for the results, then press next.
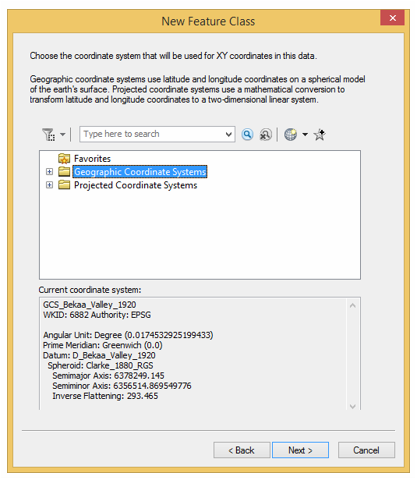 Figure 6: Selecting the Projection
The projection should be the same as the base layer and the georeferenced image file. If different projections/coordinate systems are utilized they might impact the alignment of items.
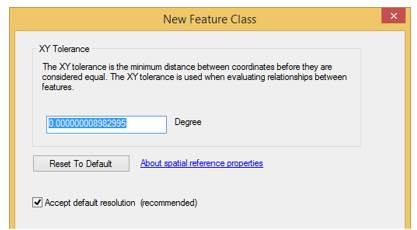 Figure 7: X, Y Tolerance
The default tolerance will be used for the X Y plane. Note: only part of the window is shown in Figure 7.
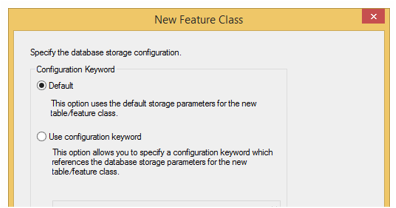 Figure 8: Database Storage Configuration
The default configuration of the database will be used. Note: only part of the window is shown in Figure 8.
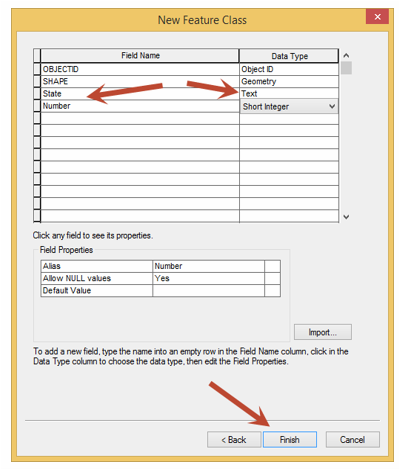 Figure 9: Fields (attribute) Creation
Fields can be created as part of generating a new feature class or can be created later. In Figure 9 two new fields were produced, one for state name and the other for unit number. The state Data Type is text, it was specified to be 20 characters. The Number field was made a Short Integer data type. Note: it is important to set the proper data type when creating the field. The State field would be useful to set as a domain, since all the states to be used can be placed into the domain and a simple pull down menu accessed. This will insure no spelling errors when selecting the state which the regiment came from. Good planning of what is to be created is very important. However, it is typical that once starting the digitization process other attributes that are needed can be discovered. They can be added, but remember, already digitized features will need to be corrected. Hopefully this would happen early in the process, since the added fields will need to be manually populated by the user for those features already digitized.
ArcMap
Load the newly created feature class(s) onto the basemap, other layers may have already been loaded. There is no data in the newly created feature class, therefore nothing will be displayed. From a functional and organization standpoint all feature classes to be edited should be in the same geodatabase.
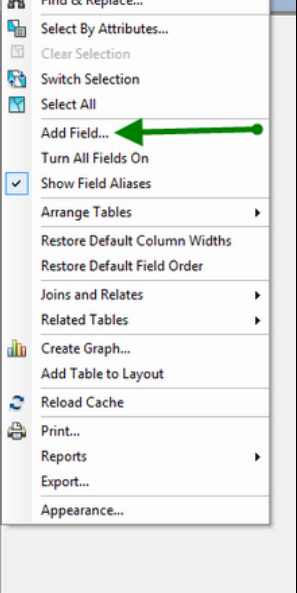 Figure 10: Adding a Field
Attribute Table
The attribute table does have features that will define the line position (troop position) by default. The table does not have specific information such as which army they were with or the time they were at that location, unless added during creation. Other fields might include the commander of the regiment, regiment number, brigade, division and corps. Fields can only be added when the editor is turned off, right click on the file name to open the attribute table. Click on the first icon on the attribute table and select Add field (see Figure 10). Multiple fields can be added in this window, preplanning is important so that all required fields are added initially or before a large amount of data is added. However, new fields can be added anytime during the process. Adding all the fields at one time gives the user the ability to add all the data during the creation/editing process and not require modifications during the data input phase.
The attribute table does have features that will define the line position (troop position) by default. The table does not have specific information such as which army they were with or the time they were at that location, unless added during creation. Other fields might include the commander of the regiment, regiment number, brigade, division and corps. Fields can only be added when the editor is turned off, right click on the file name to open the attribute table. Click on the first icon on the attribute table and select Add field (see Figure 10). Multiple fields can be added in this window, preplanning is important so that all required fields are added initially or before a large amount of data is added. However, new fields can be added anytime during the process. Adding all the fields at one time gives the user the ability to add all the data during the creation/editing process and not require modifications during the data input phase.
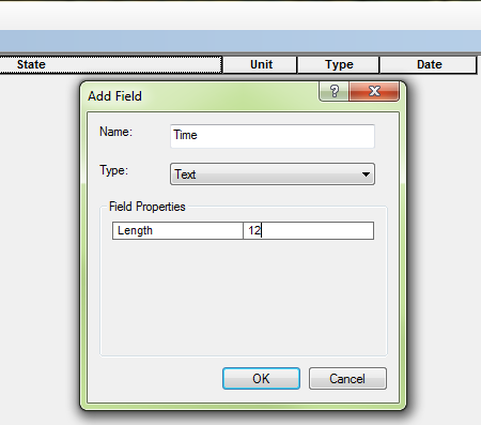 Figure 11: Data Type
Remember this process must be done with the editor turned off. Spaces cannot be used in the name and there are limitations in the number of characters for the name. In addition the type of data that is being created must be determined beforehand and cannot be changed later in the project (text, numeric, raster, etc.) see Figure 11.
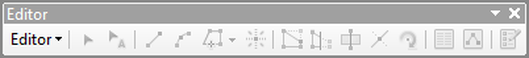 Figure 12: Editor Toolbar
Editor
Once the appropriate fields have been added, the editor will need to be activated.
The editor can be found under the customize tab in the toolbars menu. The editor is a toolbar so it can be either docked or floating, see Figure 12. The first button in the editor is a pull down and is used to start the editor.
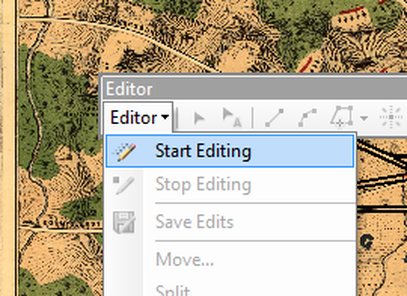 Figure 13: Starting the Editor
Once the editor has been started the information to be edited must be selected. If multiple files are located within a single geodatabase it is easy to select the file to edit. For this lesson select the file which was created, remember the file initially has no data contained within. If the data is composed of points it must be placed in the file that was created for a point file, same is true with lines and polygons. The file in this example was a line file type to represent the troop positions.
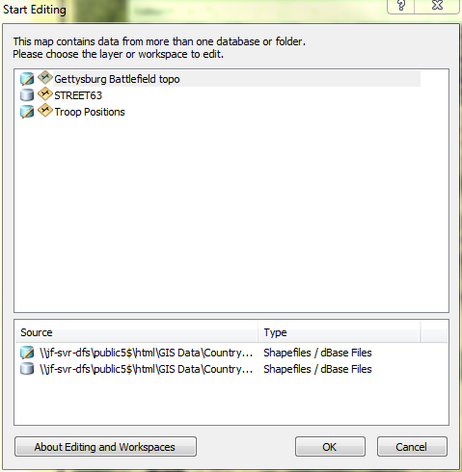 Figure 14: Selecting the shapefile
Let’s assume that for the Gettysburg Battlefield, a historical map was used which, was created showing the troop positions at 4 PM on July 2, 1863 (the second day of the battle). When this information is digitized, for the position of regiments on the field of battle, a designation for Union troops and different one for Confederate soldiers is required. They could be placed in one or two line files, if placed in a single file (suggested method) they would have an attribute for which army they were part of. The file would also need to have fields that designate the regiment, brigade, division and corps they belonged to so that they can be queried when using the map, the officer in charge might also be an attribute. Start the editor and click on the line of a single regiment, it might just be two points or it could be multiple points depending on the arrangement of the battlefield. To complete the line double click on the end. The placement of the regiment would be complete and then fill the appropriate fields in the attribute table. If consulting multiple georeferenced maps that show positions at different times during the battle, a time field might also be included, so that the time of the day could be queried.
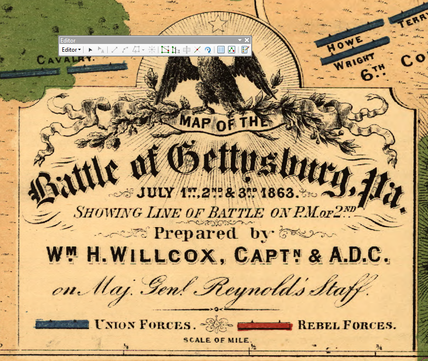 Figure 15: Map Legend
For this lesson a georeferenced map of the Gettysburg Battlefield will be used. The information about the map is contained in the title block see Figure 15.
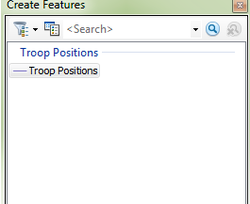 Figure 16: Layers which can be Edited
The editor has been started for the target file Troop Position.” (See Figure 16)
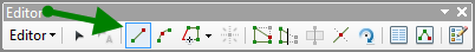 Figure 17: Editor Toolbar
Next select the line tool in the editor window, as seen in Figure 17.
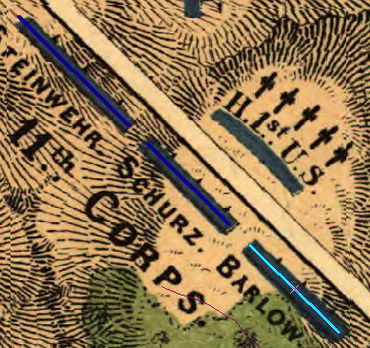 Figure 18: Creating a Line
To digitize a regiment position click one end of the line representing the position. If it is a single straight line double click on the other end of it, which will cause the line to be completed and selected. This process has only created a position for the troops but has not created any type of attributes for the record. What regiment is at this position? The time in which the regiment is at this position? In Figure 18 there are three different regiments each having been digitized with the one on the far right being the last one created, it is shown as the selected position.
 Figure 19: Attribute Table
To give the digitized troop unit attributes open the attribute table for this file. While still in the editing mode fill in information about each unit. In Figure 19, the attributes to be collected are displayed. On the map in Figure 18, utilizes the commander’s name instead of the more traditional state and unit number, thus additional research would be required. To speed the data input, domain files can be created, which would utilize pull downs to log information.
Domains that might be created would include state names, corps, army, date and time.
The process would be continued until all regiments have been digitized. Multiple maps can be georeferenced with additional information digitized. By querying the data appropriately the troop positions can be put into motion for the different times of day, which makes the static map much more dynamic. When a query is performed remember misspellings and different capitalization will result in not all items being selected appropriately, this is another reason to set-up domains for different fields.
Once the editing has been completed stop the editor and save the edits, it is suggested that edits are saved periodically, so that data is not lost. Data has now been added to the feature class that was created using ArcCatalog. Additional files for different types of features can be created, such as positions of key officers (a point file), location of important structures (a point file), existing streets (a line file).
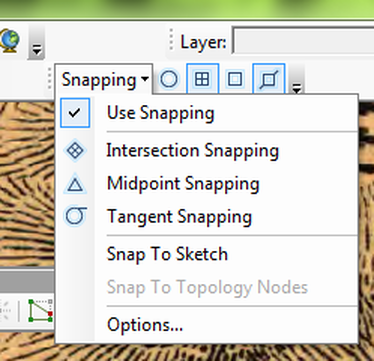 Figure 20: Snapping
Snapping
o insure that surfaces connect seamlessly there is a snap feature which is located under the editor pull down. When using Snapping a new toolbar will be launched. There are times that Snapping is not wanted and can cause problems. For example, when close to a feature Snapping will automatically grab and move the cursor to an unwanted position. Snapping to items on a raster is not permitted, but Snapping can be used to edit files or to connect a location to that of another shapefile on the map. When the process is completed a vector shapefile will have been constructed that can be managed like any other feature class, based on a raster image. The feature class can be displayed without the raster image (1863 map) and values from different maps can also be added to the file. This method allows data to be extracted from a historical map which was geographically referenced.
o insure that surfaces connect seamlessly there is a snap feature which is located under the editor pull down. When using Snapping a new toolbar will be launched. There are times that Snapping is not wanted and can cause problems. For example, when close to a feature Snapping will automatically grab and move the cursor to an unwanted position. Snapping to items on a raster is not permitted, but Snapping can be used to edit files or to connect a location to that of another shapefile on the map. When the process is completed a vector shapefile will have been constructed that can be managed like any other feature class, based on a raster image. The feature class can be displayed without the raster image (1863 map) and values from different maps can also be added to the file. This method allows data to be extracted from a historical map which was geographically referenced.
